The first four of these tasks are similar to those of the previous Week, but the diagrams are more curtailed and we don't explicitly mention scaling. A scaling interpretation fits here, but a more 'static' parts-of-a-whole approach would also work.
The first two tasks use the changing length of a bar to model the product of two fractions. When the changing lengths are viewed in terms of scaling, this provides a powerful and quite accessible interpretation of 'fraction of a fraction'. However, as with the corresponding tasks from last Week, it is relatively difficult to use the model to derive the precise value of the product.
As with last Week, the next two tasks use area to model the product, where it is much easier to find the precise value of the result. On the other hand, if we want to encourage pupils to interpret the product as scaling, then they might find the idea of scaling in one direction and then another, as rather contrived.
Finally, as a coda, we model the fractions as points in the Cartesian plane.
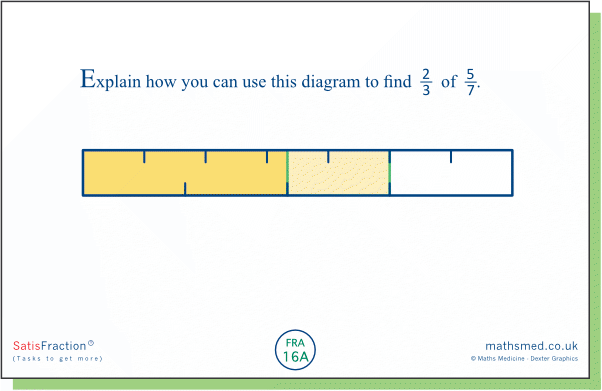
Task 16A: Here 5/7 of a rod is (are?) shaded, and then 2/3 of that is shaded further. We can see that the resulting darker yellow region consists of about half the rod. How could we sub-divide the top and bottom scales on the rod so that the intervals on the top are the same size as those on the bottom?
In the diagram below, the scales along the top from A to B and along the bottom from D to E, have been made the same by subdividing each of the original 5 parts from A to B into 3 equal parts and by subdividing each of the original 3 parts from D to E into 5 equal parts: 5×3 = 3×5. This means 7×3 of these subdivisions would fit between A and C and so each of these is 1/21 of the rod.
The above argument is quite complex but it leads to a relatively simple observation: 7 and 3 are the denominators of the two fractions; their product, 21, gives the number of parts into which the rod has been subdivided.
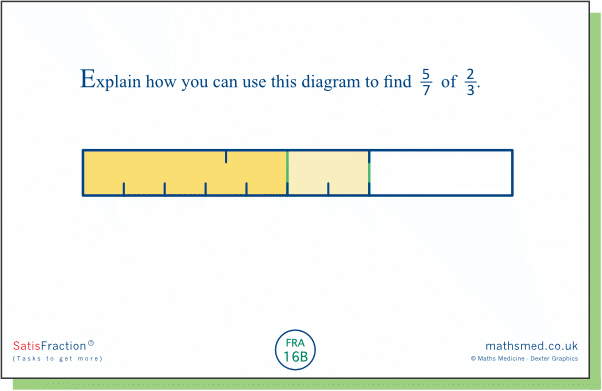
Task 16B: Here we are multiplying the same two fractions as in Task 16A, but in the reverse order. Will the result be the same?
We can see that the values of ⅔ of ⁵⁄₇ and ⁵⁄₇ of ⅔ are the same, by aligning the rods from Tasks 16A and 16B (below). Pupils will probably not be surprised by this, given their experience of multiplying whole numbers. However, this doesn't mean that the diagram is particularly transparent. Why do the values turn out to be the same?
Task 16C: Here the pieces into which the shaded regions have been partitioned don't need to be partitioned further. Ten of these cover the darker yellow region, so all that remains is to determine their size by seeing how many are needed to cover the whole rectangle. It is relatively easy to see that this is 6 more than the ones shown in the diagram and that the total is given by the product of the fractions' denominators: 3×7 = 21. So ⅔ of ⁵⁄₇ = ¹⁰⁄₂₁.
Task 16D: Here the order of the fractions has been reversed again, but the result is the same.
In contrast to the diagrams for Tasks 16A and 16B involving a rod, in these later two tasks it is easy to see that the results are the same, and why they are the same. In both cases, the dark yellow region and the whole rectangle have been partitioned into the same number of equal parts, given by 2×5 = 5×2 = 10 and by 3×7 = 7×3 = 21, respectively.
Task 16E: This is much more sophisticated. Fractions y/x are represented by the coordinates of points in the Cartesian plane, and equivalent fractions by points on straight lines through the origin. So the fraction ⁵⁄₇ is represented by the point (7, 5) shown in red, and by the equivalent point (21, 15). Two thirds of this fraction is represented by the point (21, ⅔ of 15), or (21, 10) which represents the fraction 10/21.
Task 16E': This is an alternative version where the fraction ⅔ is plotted first. We again end up at the point (21, 10)
Here (below) we can see that the two graphs take us to the same place, the point (21, 10), which represents the fraction 10/21.


